
Why does the US economy perform better under Democrats than Republicans?

A few minutes every morning is all you need.
Stay up to date on the world's Headlines and Human Stories. It's fun, it's factual, it's fluff-free.
“Since Carter, no Democratic President has had a recession begin on their watch. At the same time, no Republican President – including the single term Presidents (George H.W. Bush and Trump) – has gotten through their time in the White House without a recession.”
Despite the widely held belief that Republicans are better at managing the economy than Democrats, the history of the United States economy tells a different story. In nearly every metric one might use to measure performance, Democratic presidents have presided over greater economic growth.
Strikingly, this is not even by a slight margin. According to a paper published in 2013 by Princeton economists Alan Blinder and Mark Watson, the performance gap is “startlingly large” – so much so that it “strains credulity, given how little influence over the economy most economists (or the Constitution, for that matter) assign to the President of the United States.”
The pair suggests that this is not due to time sensitive matters or partisan fiscal or monetary policy. Instead, they attribute this gap in large part to “benign oil shocks, superior TFP [total-factor productivity] performance, and more optimistic consumer expectations.”
In short, they chalk it up to one part “luck,” another part “self-fulfilling prophecy” – whereby consumers anticipate the economy will flourish under a Democratic leader and then drive the economy upward – and a third part that’s, well, “a mystery.”
Blinder and Watson maintain that what is known only accounts for 46-62% of the 1.8 percentage point Democratic-Republican (D-R) growth gap, insisting that “the rest remains, for now, a mystery of the still mostly-unexplored continent.”
Still, they say that it is “highly unlikely that the D-R growth gap was just luck.”
In any case, it’s important to understand what economists do know about the influence of a president’s partisanship over the country’s economy, even if it does not fully explain the variance.
So, what do we know?
To understand, analysts look back in history at the average gross domestic product (GDP) growth rates under various presidents. This compares the current quarter of a country’s economic output to the prior quarter.
Blinder and Watson, in particular, looked closely at seven complete Democratic presidential terms (Truman-2, Kennedy-Johnson, Johnson, Carter, Clinton-1, Clinton-2, and Obama-1) and nine complete Republican terms (Eisenhower-1, Eisenhower-2, Nixon, Nixon-Ford, Reagan-1, Reagan-2, Bush I, Bush II-1, and Bush II-2), with the number that follows the name indicating the specific term for two-term presidents.
In these 16 presidential terms, totaling 64 years of office, the real GDP growth averaged 3.33% annually.
However, the average growth rates under Democratic leaders averaged 4.35% compared to their Republican counterparts, at only 2.54%.
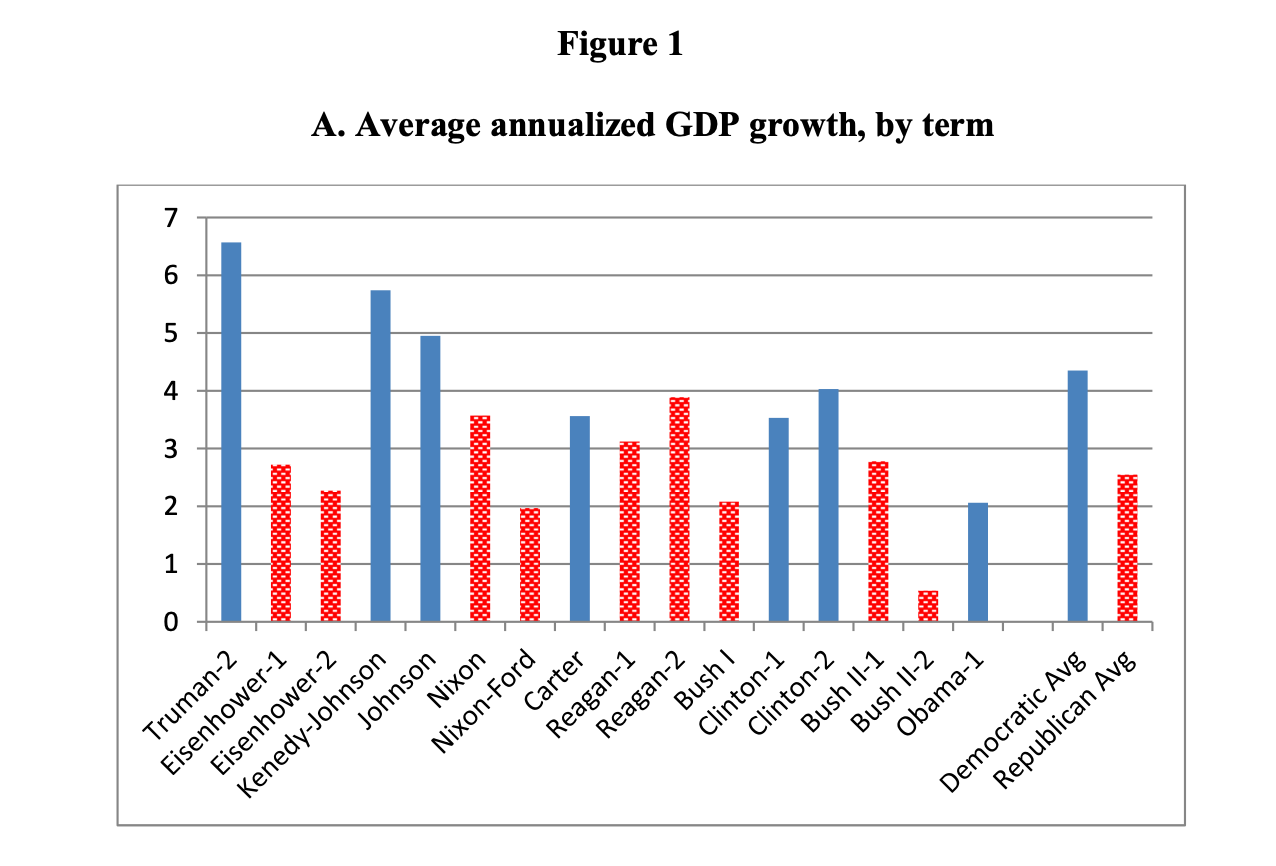
“This 1.80 percentage point gap is astoundingly large relative to the sample mean,” writes Blinder and Watson. “It implies that over a typical four-year presidency the U.S. economy grew by 18.6% when the president was a Democrat, but only by 10.6% when he was a Republican.”
According to the National Bureau of Economic Research (NBER), the contrast is even more profound.
Of the 256 quarters in the above 16 terms, the NBER classified 49 as periods of recession. Only eight of those 49 came under Democratic leadership, with the majority, 41, coming under Republican leadership.
“Since the New Deal, Democrats have been much more comfortable using the power and resources of the federal government to slow, stop, and reverse declines they inherited upon taking office,” Michael Montgomery, former US diplomat specializing in economic and commercial affairs, tells TMS.
“The net effect has been that, since Carter, no Democratic President has had a recession begin on their watch. At the same time, no Republican President – including the single term Presidents (George H.W. Bush and Trump) – has gotten through their time in the White House without a recession.”
As you can see in the chart above, the six presidents who led the country during periods that saw the most significant economic growth were Democrats, while those who led during periods that saw the most significant economic decline were Republicans.
But, why?
The bulk of the Democratic edge comes from higher spending on consumer durables – or manufactured products that are expected to have a relatively long “lifespan” (such as a car or a household appliance) – and private investment, where the partisan gap is 4.8%. Blinder and Watson insist that these two factors reflect the general confidence in the US economy.
Another approach is to look at income inequality, which many believe rises under Republican leadership and falls under Democratic.
Kevin Bell, a partner in the Washington, DC office of Arnall Golden Gregory, LLP, and a former adviser to the Chinese Embassy, tells TMS, “Democrats disperse money more generally toward income equality between classes.”
“Republicans will argue that increasing the minimum wage will crush small businesses, when it actually gives people more confidence,” he says. “This creates more freedom as opposed to being siloed within corporate America.”
“For example,” Rick Orford, personal finance writer at The Financially Independent Millennial, tells TMS, “Democrats focus on assisting the poor and middle class. Further, Democrats tend to prefer spending their way out of a recession, as we saw with the $700 billion spending plan known as TARP during the financial crisis in 2008. Fast forward to 2020/2021, and the COVID-19 pandemic stimulus is set to inject as much as 4 Trillion into the US economy.”
“On the other hand,” Orford continues, “Republicans favor an improved business environment. The theory is that lower taxes (for businesses) allow them to hire more people, which creates increased tax revenue, leading to a lower deficit over time.”
“A business-friendly position tends to lead people to believe that it’s better for the economy, but this is mostly inaccurate in the last 70 years,” he says.
This is particularly interesting, as businesses typically vote Republican while performing better under a Democratic president. Firms in the S&P 500, for instance, typically see stock market returns that are 5.4% higher under a Democratic president than a Republican one. Still, as stock prices are extremely volatile, the gap would only be truly statistically significant at 17%.
As with the stock market, the corporate profit share of gross domestic income was also higher under Democrats, at 5.6% compared to 4.7% with Republicans.
Other analysts approach the D-R gap by looking at growth in total factor productivity (a way of measuring labor and capital input with total output). This is also greater under Democrats: at 1.9% vs 0.9%.
Still, the only notable exception to this Democratic advantage is inflation, where the economy fairs about equally well for either party, tending to show a marginal rise under Democrats (1.05%) and a fall under Republicans (0.83%).
Blinder and Watson contend that this difference may be due to weaker GDP growth and lower employment growth under Republican leadership. To do so, they point to Staiger, Stock, and Watson’s research in 2001.
The economists write that “With unemployment averaging 0.4 percentage point less under Democrats, traditional estimates of the Phillips curve (e.g., Staiger, Stock, and Watson (2001)) suggest that the change in inflation should be roughly 0.1 percentage points more per quarter, or about 1.6 percentage points over a four-year presidential term—which is close to what we find.”
Further, economists might also look to more historical data for answers, asking, “Does this ‘rule of thumb’ apply only to modern presidents, or has this been universal in American history?”
Historical data
While official quarterly GDP data only began in 1947, in 2013, Owyang, Ramey, and Zubairy constructed a quarterly real GDP series that dates back to 1875.
For the 72-year period between 1875 and 1947, the average GDP growth rates in this data are 5.15% under Democratic presidents (119 quarters) and 3.91% under Republican presidents (169 quarters).
Similarly, NBER maintains that the US economy was in recession 133 of those 288 quarters, 94 of which were under Republican leaders compared to only 39 under Democratic leaders.
In any case, Blinder and Watson insist that “the Democratic growth edge over the 1875-1947 period is, however, entirely due to the economy’s excellent performance under Franklin Roosevelt [7.4% per annum]. Excluding the FDR years, growth was actually higher under Republicans. So one might say that Democratic growth superiority began with Hoover.”
It is also crucial to note the influence, or lack thereof, that the House of Congress has over this D-R growth gap.
To understand this, we look at the average GDP growth rate when Democrats control both houses of Congress (3.47%), compared with Republican control (3.36%). The difference is rather insignificant. With this, it becomes clear that Congress’ role is less relevant in explaining the D-R gap.
Some wonder if, perhaps, presidential transitions play a role in the Democratic advantage. Meaning, is it possible that the leaders are simply inheriting an economy from their Republican predecessors?
To understand this, economists look at presidential growth within the first year of office.
Democratic terms average 4.7% in the first year, compared to only 0.6% in the first year of a Republican term. However, Democrats only inherit growth rates of 1.8% from the final year of the previous term, while Republicans inherit growth rates of 4.1%.
“Given the strong positive serial correlation in GDP growth, momentum clearly helps Republicans,” writes Blinder and Watson. “Thus the election of a Democrat seems to turn things around on a dime, while the election of a new Republican seems to signal a recession.”
What else could it be?
Economists turn to other metrics that might offer deeper insight into the growth gap, turning to factors such as oil shocks, federal defense spending, or fiscal and monetary policy.
Oil prices appear to explain between roughly one-eighth and one-fourth of the growth gap.
However, federal defense spending, on average, accounts for only 8% of GDP over the postwar period. So, “on balance, there is not much to the defense-spending explanation of the D-R gap, and what little there is comes entirely from the Korean War,” writes Blinder and Watson.
As for fiscal or monetary policy, it’s essential to first keep in mind that US presidents do not control monetary policy.
However, Blinder and Watson ask a more complex question: “Could it be that Democratic presidents have wielded their appointment powers more skillfully to obtain more growth-oriented Federal Reserve Boards? … Did the U.S. economy grow faster under Democratic Fed chairmen than under Republican chairs?”
The pair answers this with a resounding: yes.
Average GDP growth rate was 4% when Democrats led the Fed, but only 3.74% when Republicans did. Likewise, the economy grew fastest (5.27%) when Democrats held both offices (example: Truman and Martin) and slowest (2.41%) when Republicans held both (example: Bush I and Greenspan).
In terms of monetary stabilization, there is roughly a zero slope across either Democratic or Republican presidencies. That is, virtually no monetary stabilization under either party. Still, if there is any partisan tinge to monetary policy at all, it seems to favor Republican leaders. This is because nominal rates (interest rates before inflation) show distinctly positive slopes under both parties, with a steeper slope under Republicans.
Still, all things considered, it remains clear that Democrats have had, by and large, a more positive influence on the economy than their Republican counterparts, contrary to popular belief.
Unfortunately, explaining the “why” behind this is not easy, nor is it even fully understood, but it is certainly not insignificant. It can perhaps be boiled down to a series of “luck” shocks, an optimistic consumer base, or simply a more effective approach in leadership.
In any case, “if history repeats itself, under Joe Biden’s presidency, we can expect a period of economic improvement, gains in the job market, in addition to GDP," says Orford.
“Objectively, while the bar is set rather low during the pandemic, with vaccines getting distributed worldwide, there’s a reason for hope.”
Have a tip or story? Get in touch with our reporters at tips@themilsource.com


Comments ()